We believe empowering engineers drives innovation.
We believe empowering engineers drives innovation.
Welcome to Rearc’s blog! We are a boutique consulting firm that is excited to bring a variety of business-ready datasets to customers. At Rearc, we are committed to helping our clients access the data they need to make informed decisions and be successful.
In this blog, we’ll walk through a data product we’ve poured a lot of love into: EpiLake Flu, a comprehensive collection of datasets that provides insights into the current state and trends of influenza transmission. Influenza is a common infectious disease, and understanding its scope and severity is critical for informing public health interventions and preventing outbreaks. EpiLake Flu is designed to be a one-stop-shop for anyone looking for high-quality flu data, and can be accessed in the AWS Marketplace or on the Databricks Marketplace.
We hope you find this blog post informative, and we look forward to hearing your feedback. Thank you for joining us!
With flu season seemingly always right around the corner, it’s important to understand the spread and impact of influenza. Flu data plays a crucial role in informing decision-making for a wide range of stakeholders, from epidemiologists tracking the severity and spread of the flu, to insurers managing the risks and costs associated with flu-related illness, to retail and consumer packaged goods (CPG) companies forecasting demand for flu-combating products.
But the value of flu data extends beyond the business world. By tracking the trends and patterns of influenza transmission, public health officials can identify and target prevention and control measures to high-risk populations, reduce transmission, and prevent outbreaks. Flu data is also a key resource for vaccine manufacturers, who rely on it to anticipate demand and ensure sufficient production and supply of life-saving vaccines.
In short, flu data is valuable because it helps us understand and address one of the world’s most common and deadly infectious diseases. EpiLake Flu is here to provide the high-quality, accessible data that stakeholders need to navigate the complex landscape of influenza from every angle: transmission, testing, hospitalizations, and more.
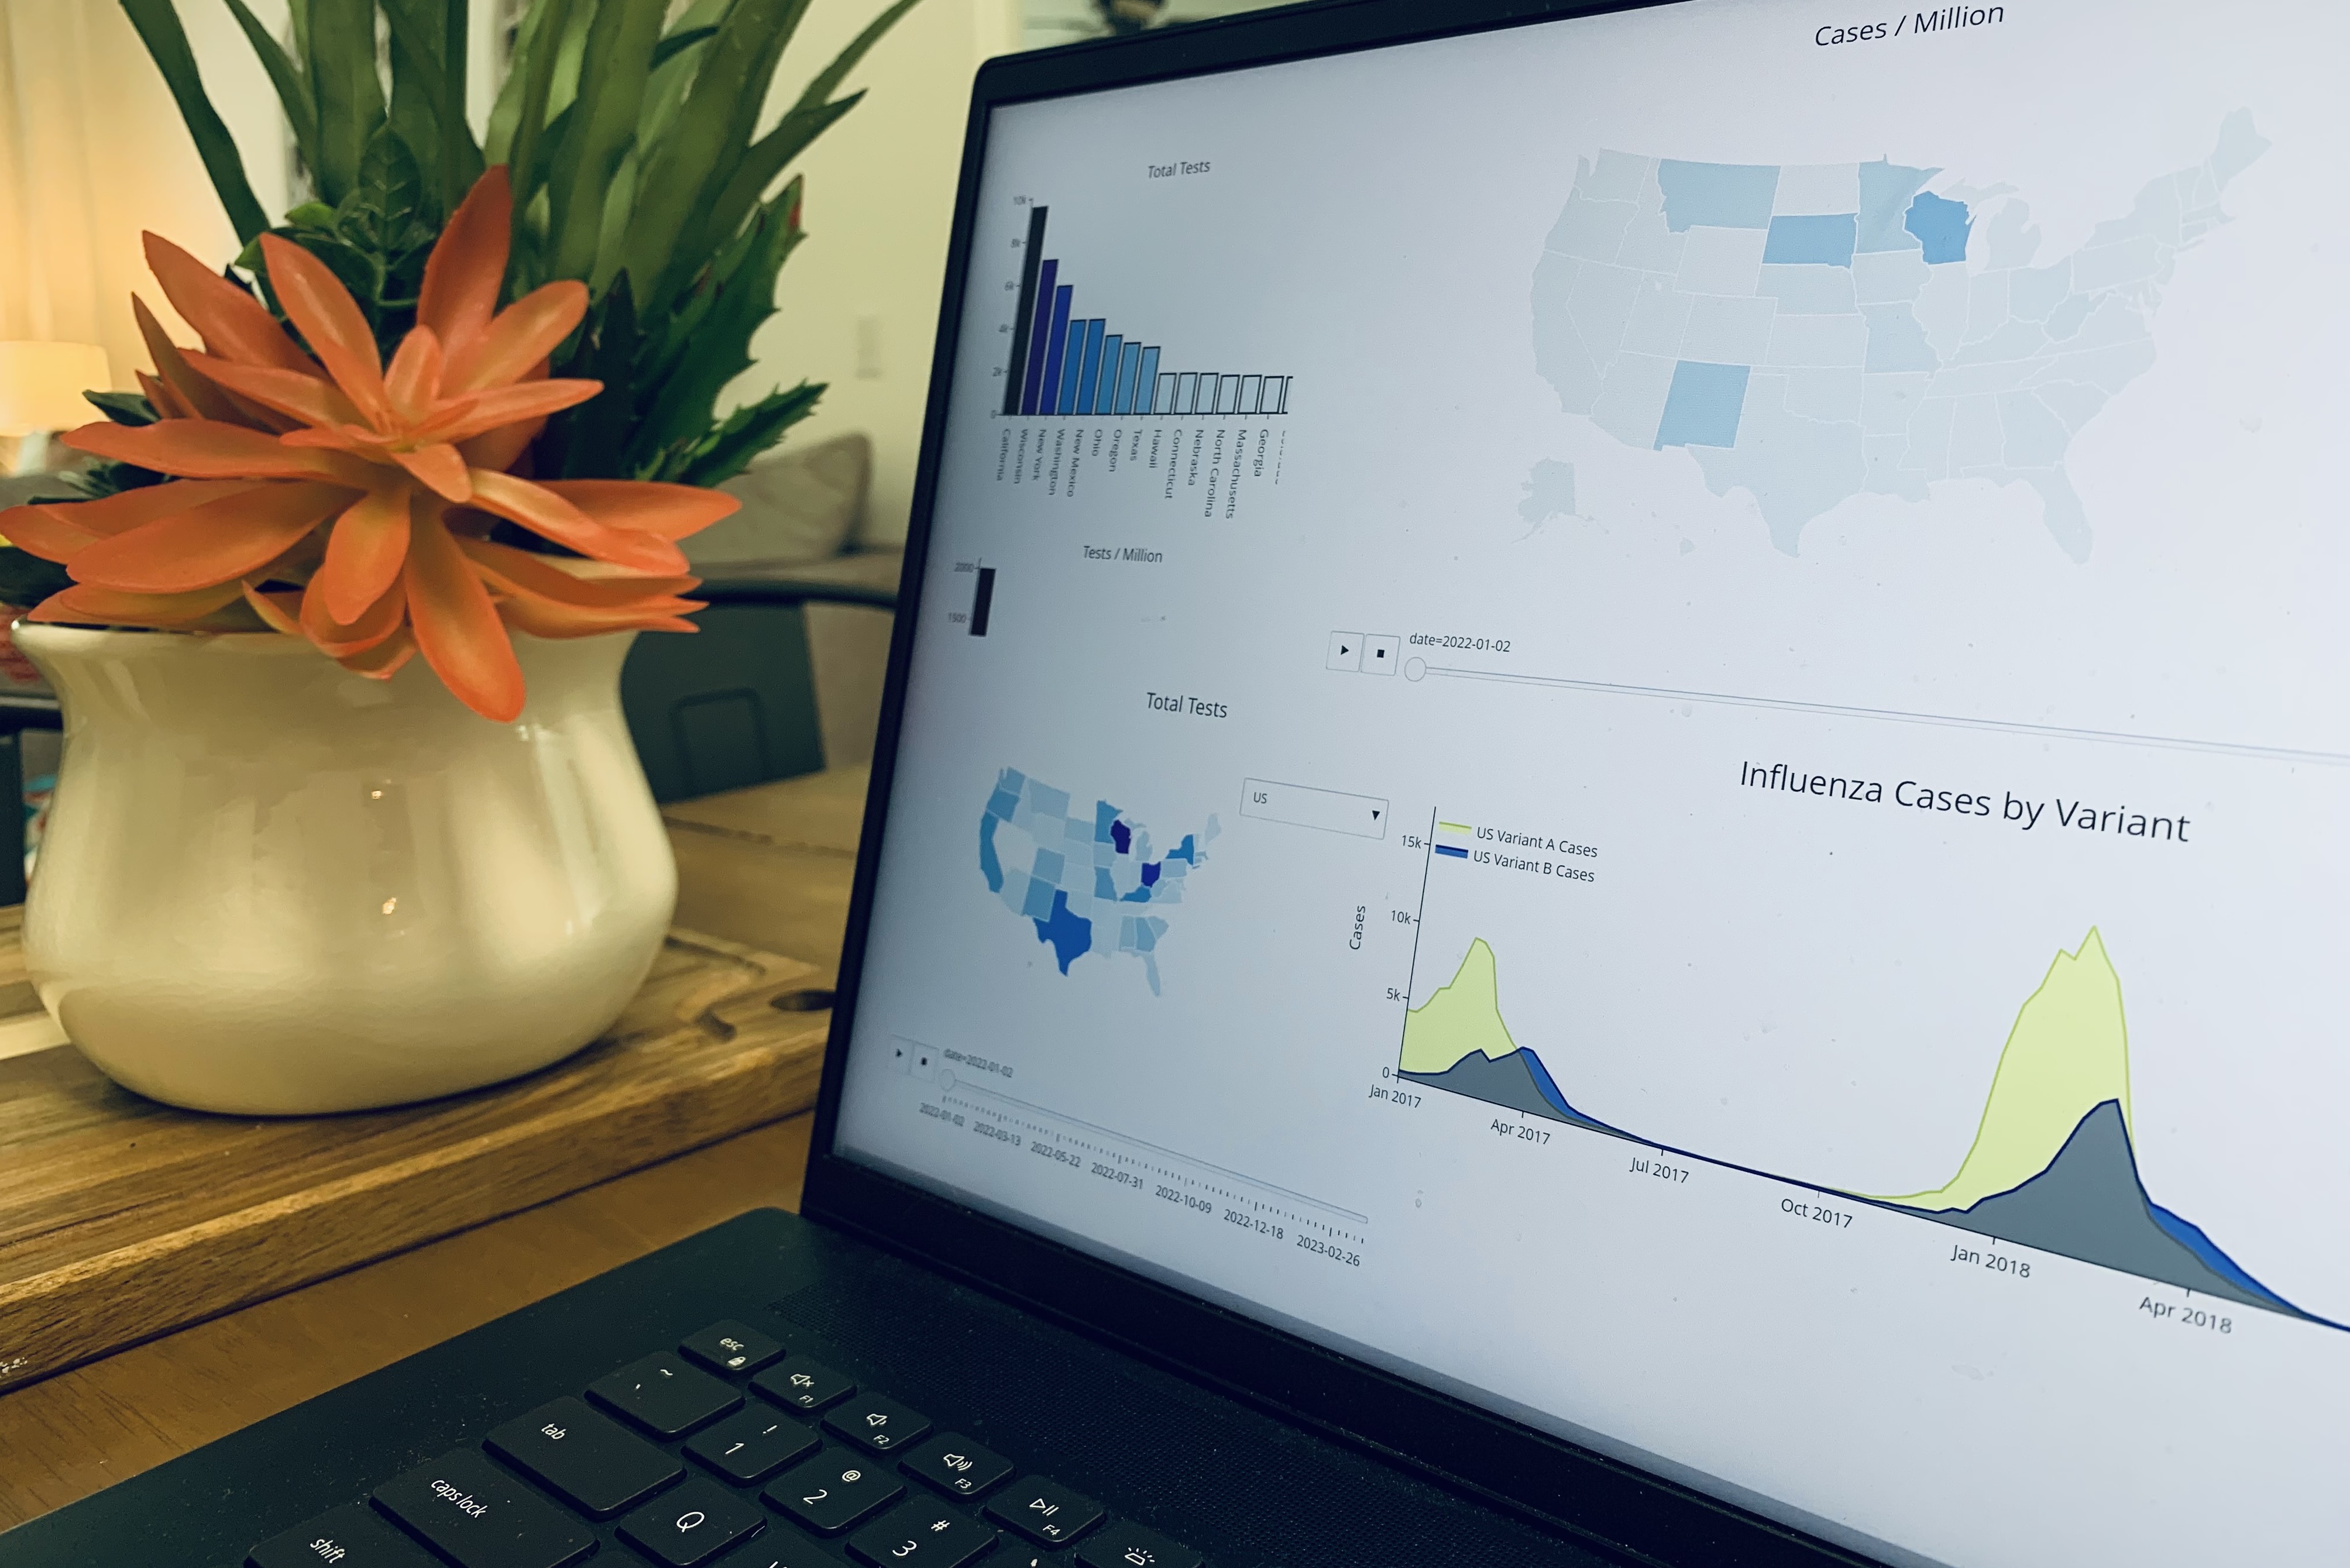
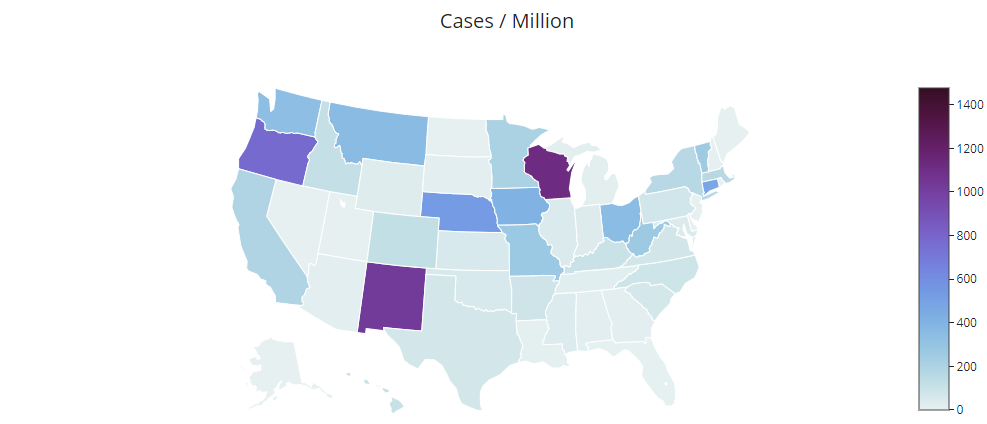
EpiLake Flu is a comprehensive collection of datasets and visualizations that provides insights into the current state and trends of influenza transmission, and allows users to easily digest key flu statistics by state, including the number of cases, tests, and percent of tests that are positive.
- What states are currently experiencing surges in influenza incidents?
- Cases seem high, but how do they compare to last year? 2 years ago?
- Is the current uptick in cases due to an increase in testing?
This information can help you diagnose the overall burden of influenza in different states and quickly understand the current state of influenza across the United States.
With EpiLake Flu, we can also examine the distribution of influenza cases over time by state. With our existing dashboards, you can manipulate the time frame to see how the patterns of testing and transmission have changed over years and seasons. This visualization can help you identify hot zones and understand the spatial and temporal trends of influenza transmission.
Using EpiLake Flu data, we can also provide a multi-layered view of influenza activity in the U.S. by showing the trends in total flu cases, tests administered, and the percentage of positive tests simultaneously. This information can help you understand how total detected cases might operate as a function of tests administered and better assess the real impact of a current flu season relative to the total number of cases along with the percentage of tests coming back positive.
In addition to United States level influenza cases and tests data, we also have a wealth of more specific granular data in EpiLake Flu, including specific variant breakdowns for each and every state in the country. This data enables a greater awareness of the relative prevalence of different strains of influenza in a specific region and may enable a user to identify any shifts in the dominant strains over time. This information can also be used to inform vaccine formulation and target vaccination efforts to the most prevalent strains.
While understanding the overall trends and patterns of influenza transmission is important, there may be times when you need more granular data to inform your decisions. EpiLake Flu provides access to data at the county level for several states, allowing you to drill down and understand the local context of influenza transmission.
County-level data can be particularly useful for insurers trying to understand the local risks and costs associated with influenza. By having access to this data, insurers can identify areas with higher rates of flu transmission and assess the potential impact on their clients. This information can be used to inform risk management strategies, such as identifying high-risk populations and targeting prevention and control measures to these groups.
Using county-level data also allows us to cross-reference influenza data with other granular data sources, such as Social Determinants of Health (SDOH) data, enabling us to better understand the potential underlying causes of disparities in flu transmission.
This map shows the distribution of median household income by county in New York State, but household income is just a starting point. The combination of granular county-level flu data along with diverse SDOH metrics can enable us to answer all sorts of questions.
For example, which states are experiencing more (or less) flu hospitalizations/mortalities than expected during the current flu season, given their demographics?
From this we can see that Maine, West Virginia, Vermont, and Kentucky had very high expected flu mortalities (given their SDOH metrics), likely due to the fact that they are three of the four highest ranking states in the country by average age.
We can also use county-level data as our base to identify potential risk factors for influenza transmission via the SDOH dataset.
In conclusion, enriching flu data with SDOH data or other additional sources (also available at Rearc!), we can provide a much more comprehensive view of influenza trends and help our clients make more informed decisions about how to manage these risks.
EpiLake Flu may also be used to prepare for the future, making use of a wide sourcing of global influenza forecasts.
Effective inventory management relies on the ability to anticipate future demand for products. EpiLake Flu provides access to high-quality influenza forecasting data that can be used to better understand the likely demand for influenza medications in coming weeks and make informed decisions about your inventory management.
The above visualization compares forecasts and actual results for influenza hospitalizations, broken down by specific forecasting methodologies. In EpiLake Flu we store these predictions for each state, as well as predictions for the entire United States.
We also provide forecasts for influenza hospitalizations, by state, for up to four weeks into the future, along with confidence intervals and uncertainty estimates.
This can be especially valuable for those who are responsible for managing the demand for influenza medications and other related products and services. By anticipating influenza prevalence, you can get a better sense of the likely demand for your products and plan your inventory accordingly.
EpiLake Flu not only provides data on influenza transmission in the United States, but also includes global data that can be used to better understand the global landscape of influenza transmission. By analyzing foreign flu seasons, you can gain a deeper understanding of the various factors that impact influenza transmission and identify trends and patterns that may be relevant to your own country or region.
This visualization shows the influenza cases in Australia superimposed on the cases in the United States. You can use this visualization to compare the two flu seasons and identify any correlations or trends that may be relevant for understanding the global landscape of influenza transmission. Notice the following:
- The near disappearance of the 2021 flu season occurring in Australia before the U.S.
- The 2022 spike in Australian cases preempting a similar U.S. rise the following winter
Influenza can have significant impacts on individuals, communities, and businesses across the world. EpiLake Flu is a comprehensive collection of influenza surveillance data from Rearc that provides valuable insights into the current state and trends of influenza transmission. With this data, you can better understand the scope and severity of influenza in the United States, dig deep into potential indicators and correlations, and anticipate demand for flu-related products and services.
In addition to the data included in EpiLake Flu, Rearc also offers additional data sources that can be used to enrich the data and provide even more insights.
Thank you for joining us in this exploration of EpiLake Flu’s capabilities! Influenza surveillance data is a critical tool for mitigating and understanding the impacts of flu, and EpiLake Flu is here to help you access the data you need.