We believe empowering engineers drives innovation.
We believe empowering engineers drives innovation.

We’ve become accustomed to controlling the notifications of our lives. We tap unsubscribe on emails that offer it, we become frustrated with apps demanding too much attention, and we escape our typical work environment to that sweet single-person meeting room to get some uninterrupted work done. We crave peace.
By contrast however, it’s the very nature of joining society that we must pull up a chair and turn up the volume high enough to catch the next wave. We cannot blindly delete the content in our inboxes as there is ever-present opportunity lying just beneath the surface in the pools of data that gather there. Our inputs hold potentials for job offers, long-awaited leads, friends in need, major life updates and more.
So what are we to do? We can’t comprehend all the data the world offers nor can we mute it all! We have to locate that perfect signal-to-noise ratio. It’s time to find that beauty between.

The pyramid below is taken from Google’s Site Reliability Engineering online book and simultaneously serves as the inspiration to the content of this blog. Google outlines the critical need for Monitoring as the prerequisite for any other stability-focused activity an engineer can execute.
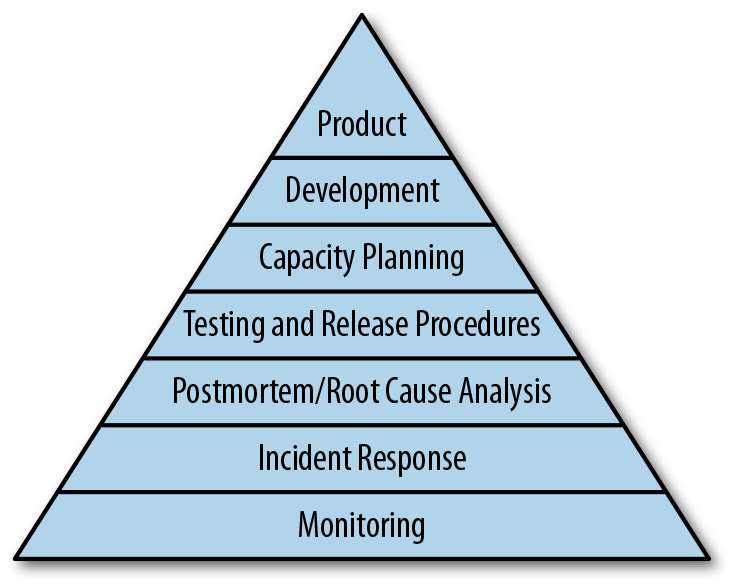
Consider now the very next tier above monitoring; Incident Response. This dependency locks Monitoring as the lifeblood of observability and the most critical component to running a stable service. Successful incident response requires engineers to navigate backward in time by diving into the emitted data of the past; hoping it exists and hoping it’s enough to correct the root cause.
Those Site Reliability Engineers are right! We must be proactive in strengthening our environments!
The bottom monitoring section on this pyramid handles everything from sensors to alerting. Let’s break down the components of a common monitoring pipeline. It is worth keeping in mind that many modern monitoring stacks combine some of these functions into the same tool.
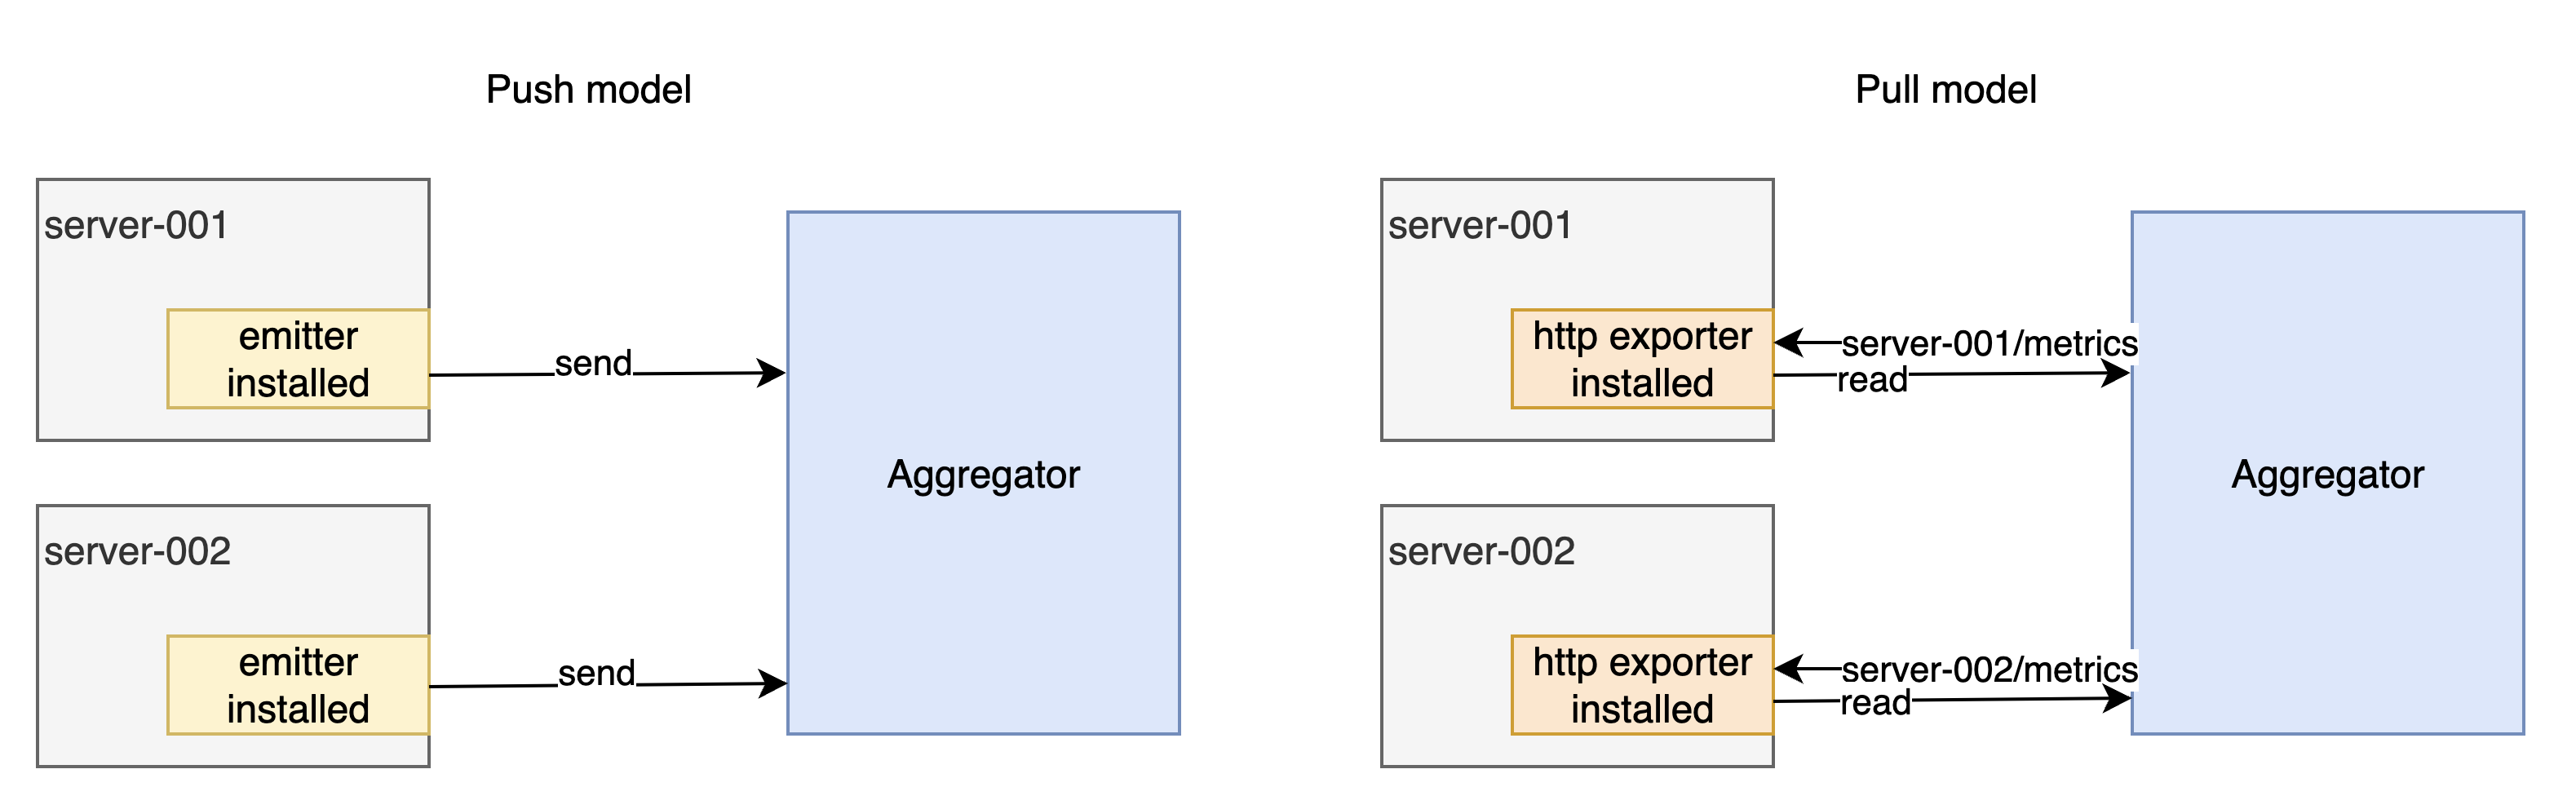
Example collectors include Beats in some push models and node_exporter in pull models, presenting the data for some scraper to come grab later in this pipeline. Application level metrics can also be exposed using custom exporters.
While many open source tools exist in monitoring, many require a heavy tuning to nail that perfect balance we seek. There’s a quicker way to get going in your cloud.
Enter Cloudwatch! Out of the box AWS provides a monitoring solution called CloudWatch. There are many AWS services which publish their metrics to CloudWatch. You may view that list in the AWS Cloudwatch Documentation.
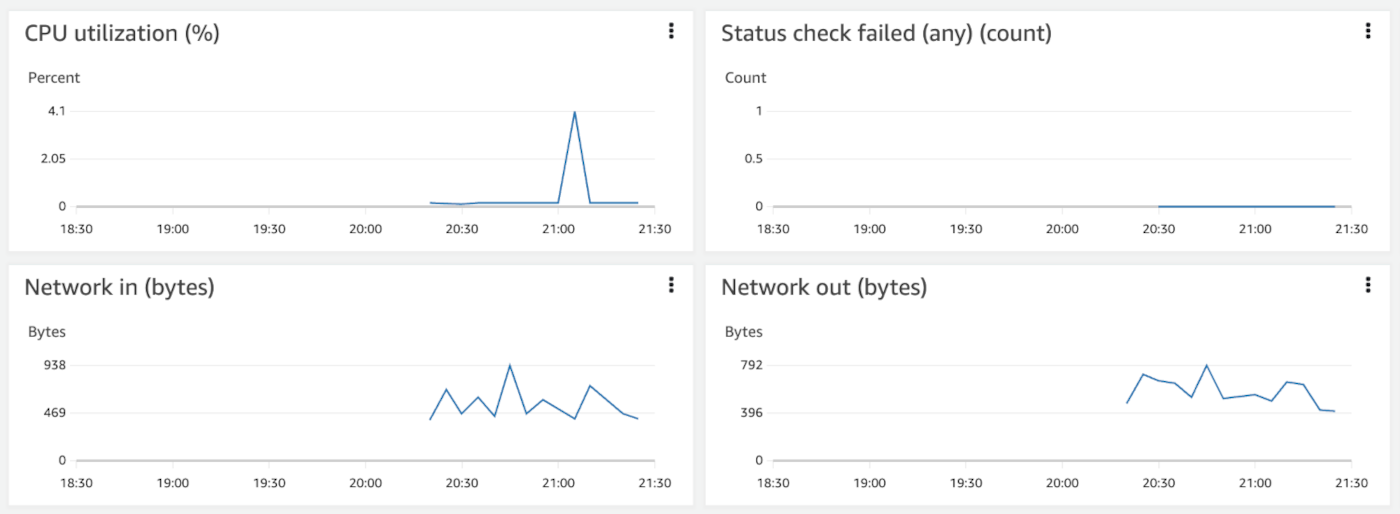
When launching a new EC2 instance for example, AWS immediately presents a basic monitoring tab with 14 metrics. While these outputs leave much to be desired it’s a starting point nonetheless! AWS services use a push model to send logs to CloudWatch, assuming metrics are enabled. Cloudwatch retains this metric data for 15 months, albeit down-sampled as the data points age.
Configuring well tuned cloudwatch alarms in your environment is critical in making sure you aren’t being alerted for non-actionable events.
If you acknowledge a page and take no action and everything remains fine in your environment then you’ve too much noise! Examine this aws_cloudwatch_metric_alarm
configuration expressed in terraform below.
How can it be modified to increase our signal to noise ratio?
resource "aws_cloudwatch_metric_alarm" "noisy-alarm" {
  alarm_name                = "noisy-alarm"
  comparison_operator       = "GreaterThanOrEqualToThreshold"
  evaluation_periods        = "1"
  metric_name               = "CPUUtilization"
  namespace                 = "AWS/EC2"
  period                    = "120"
  statistic                 = "Maximum"
  threshold                 = "50"
  alarm_description         = "This metric monitors ec2 cpu utilization, and is way too noisy!"
  insufficient_data_actions = []
}
The Site Reliability Engineering: Chapter 6 - Monitoring distributed systems chapter covers the concept of the four golden signals:
These signals are the most common tipping points in a system. Keep in mind these golden signals to help us surface metrics worth firing alerts for since there’s action we can take! For example, if CPU utilization is consistently alerting, it may indicate we need to scale the load vertically, shutting down the machine, migrating the disk to a new instance, reattaching the load balancer and resuming the workload. In environments with higher uptime requirements, we can leverage autoscaling to scale horizontally, adding nodes of the same strength to the load balancer pool without firing an alert at all. This evolution is the ultimate goal of the SRE team as SRE team workload should scale exponentially with headcount, reducing interactions while increasing overall Service Level Objective health.
Returning now to our CloudWatch alarm. If we aim to categorize CPU utilization, it is a type of fullness or in golden signal language, saturation. We want to make sure this alarm doesn’t needlessly fire. Here’s a few settings which should stand out:
statistic is set to Maximum
Sum/SampleCount during the specified period” and serves as a more suitable starting point when establishing your service alerting configuration. This will filter out the brief but intense spikes that can occur in a service which don’t cause disruption.evaluation_periods is set to 1
threshold is set to 50
Here’s the terraform code for the CPU utilization alarm, 2.0! It’s quieter and thus more likely to fire when a problem is truly cropping up and needs maintainer attention. Each alarm you configure will need careful tuning to not back off so far that you’re blind to failure events and simultaneously not so loud that you grow in the habit of snoozing alarms.
resource "aws_cloudwatch_metric_alarm" "quieter-alarm" {
  alarm_name                = "quieter-alarm"
  comparison_operator       = "GreaterThanOrEqualToThreshold"
  evaluation_periods        = "2"
  metric_name               = "CPUUtilization"
  namespace                 = "AWS/EC2"
  period                    = "120"
  statistic                 = "Average"
  threshold                 = "80"
  alarm_description         = "This metric monitors ec2 cpu utilization"
  insufficient_data_actions = []
}
Getting one alarm into shape is good, but we want to be great!
Failure states are often more nuanced than a single metric on a single instance. For example, you may have a service which only fails when multiple conditions occur. We need to relate them!
AWS CloudWatch offers a solution for combining alerts called CloudWatch Composite Alarms. The aws_cloudwatch_composite_alarm
enables you to combine several alarms into a composite alarm which only fires on certain conditions.
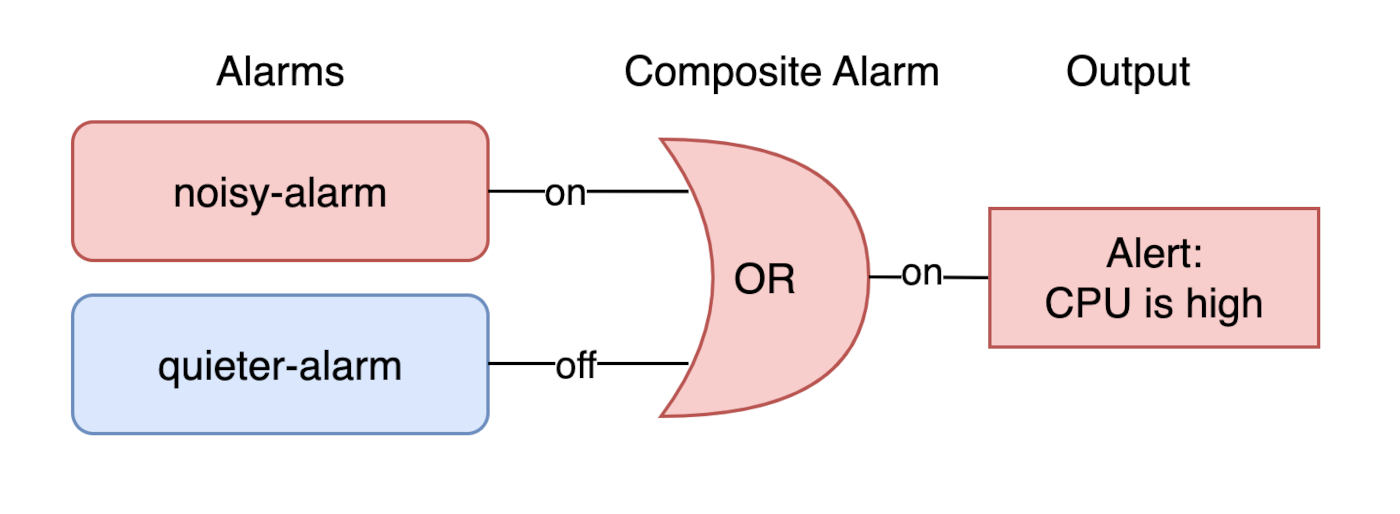
Not that we actually want to but for the sake of demonstration let’s merge our two previously defined alarms, noisy-alarm
and subsequent quieter-alarm, into a single composite alarm!
resource "aws_cloudwatch_composite_alarm" "composite-cpu-high-example" {
  alarm_description = "This is a composite alarm!"
  alarm_name        = "cpu-high-example"

  alarm_rule = <<EOF
ALARM(${aws_cloudwatch_metric_alarm.quieter-alarm.alarm_name}) OR
ALARM(${aws_cloudwatch_metric_alarm.noisy-alarm.alarm_name})
EOF
}
Of course this example is silly. We usually wouldn’t ever want to merge two identical alerts with varying settings into a composite alert like this. Let’s reach for some more realistic examples!
resource "aws_cloudwatch_composite_alarm" "disk-rooted-causing-api-failures" {
  alarm_description = "This composite alarm will fire when the disk appears to be causing api failures to increase"
  alarm_name        = "disk-rooted-causing-api-failures"

  alarm_rule = <<EOF
ALARM(${aws_cloudwatch_metric_alarm.disk.alarm_name}) AND
ALARM(${aws_cloudwatch_metric_alarm.http500s.alarm_name})
EOF
}
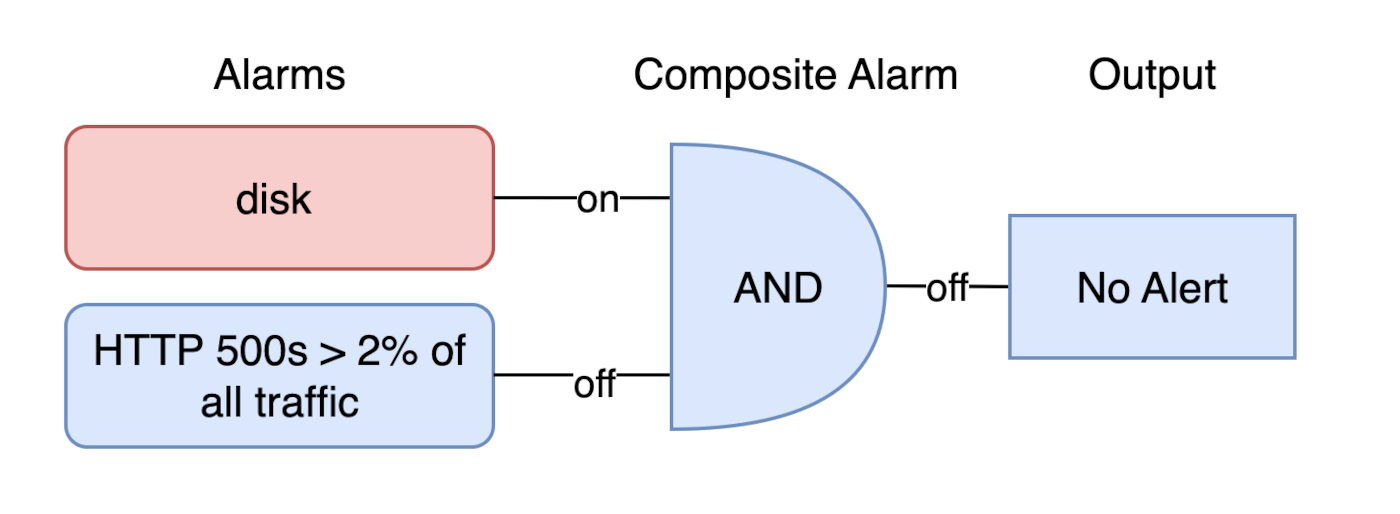
Above we’ve configured 2 cloudwatch alarms feeding into 1 composite alarm.
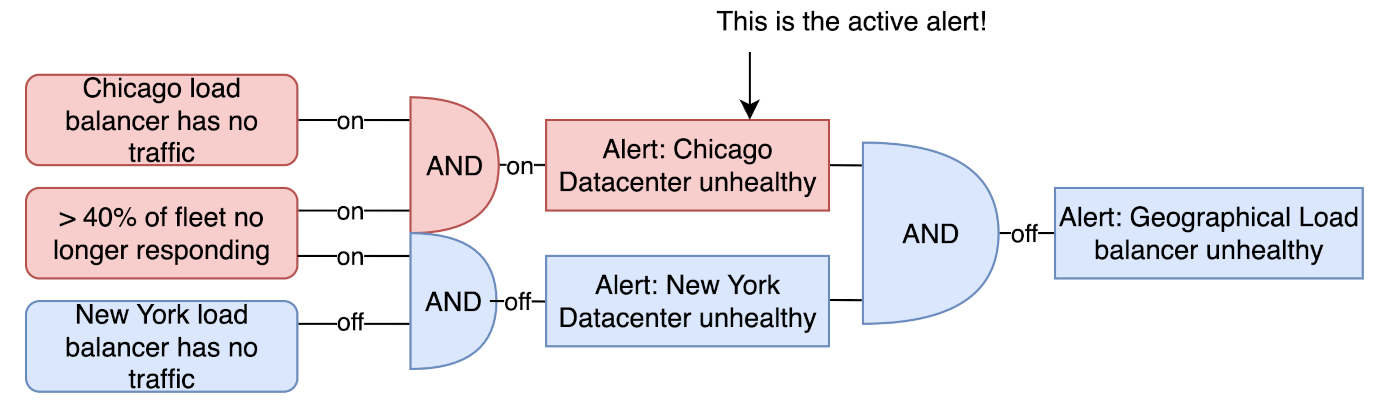
In this last example we’ve configured 3 cloudwatch alarms (left) feeding into 2 composite alarms (middle) feeding into yet another composite alarm (right). The various sensors implemented into this final example each provide different context to the overall system health. As the inputs change the alarms adjust accordingly providing the engineer with the right level of awareness to respond.
An almost constant mentality that Site Reliability engineers need to have is a stance of creativity and motivation. In most scenarios, you have the power to improve the situation. You have the ability to tune the alerts in your environment to make these hills sing.
Think through the alerts that are plaguing you today. Produce a report containing metrics on how frequently your alerts fire. Write a list if it helps your mental state, striking a tally next to each alarm when it goes off. Journal in your post-mortems. What did you have to do? Anything? Did you immediately verify something else in your infrastructure when the alert fired? How can this something else be combined to improve the systems noise level?